
Introduction
As you read this article you may bring your hand up to your chin and stroke your finger on your lips to help you concentrate. Or you may swiftly stroke the touchpad with your fingertips, move past this paragraph trying to understand whether you want to read this article. Linger on those or any other tactile sensation you may be experiencing at this moment. Linger on the ever-present beauty and complexity of your sense of touch.
Last summer at QRI we certainly did. We lingered on and explored our tactile sensations. We tried to understand them better and validate possible mathematical models of them. More specifically, we have been attempting to represent tactile sensations visually.
The nascent state of our understanding of consciousness makes it challenging to develop models of sensory perception, particularly when translating experiences between different senses. Yet, visualizing tactile sensations holds a lot of potential. Modern computer graphics enable us to craft detailed visual simulations that could explain the mechanics of tactile sensations and help communicate them more effectively. Creating reproducible tactile images may have significant implications for psychology and pain management. For example, it could allow patients to articulate their symptoms with greater clarity, enhancing diagnostic accuracy and treatment efficacy (Lor, Koleck, and Bakken 2019).
This essay recounts our efforts to visualize tactile sensations, our insights, the obstacles we encountered, and outlining a future path.
What is Touch?
Tactile sensations are perceived through the skin and include a variety of stimuli such as pressure, vibration, temperature, pain, and movement (Sherman 2019). The sense of touch is a complex system that helps organisms understand their environment, detect threats, and engage in social interactions. It is one of the fundamental ways we experience and navigate the world around us. While most of us have an intuitive sense of how touch feels, there are many lenses we can use to paint a comprehensive picture of the space in which tactile sensations live: physiology, phenomenology, psychophysics and more.
Physiology locates touch within the somatosensory systems (Sherman 2019) and classifies tactile sensations as either
- exteroceptive sensations from stimuli outside the body
- interoceptive sensations related to the condition of the body interior; and
- proprioceptive sensations that provide information about body position and movement from receptors in muscles, tendons, and joints.
Exteroceptive sensations are further distinguished by the receptors that detect them and the nature of the stimuli they respond to, including
- mechanoreceptors detecting pressure, vibration and texture;
- thermoreceptors detecting heat and cold; and
- nociceptors detecting damaging stimuli.
Phenomenological traditions categorize touch based on the subjective experience of the sensations (Toadvine 2023), using dimensions such as
- valence - measuring to what degree a sensation is pleasant, painful or neutral;
- arousal - measuring how intense a sensation is;
- complexity - describing whether a sensation is basic contact with the skin or complex combination of pressure, slip, vibration, etc.
- distinguishing whether a sensation results from active movement or passively occurring when stimuli are externally applied to the skin;
- the social function of a sensation (e.g comforting, intimate, playful, etc.)
- measuring the cross-modal interaction between touch and other senses;
- whether the sensation generated in the physical world or by the mind.
The distinction between physical and mental sensations plays a key role in meditative practices. For example, Shinzen Young (Young 2016) refers to it as the external-internal channel dichotomy and invites practitioners to meditate on both external and internal sensations within each sensory channel.
Psychophysics examines the relationship between physical stimuli and the sensations they produce. In the context of tactile sensations, the psychophysical approach concerns with quantifying the touch experience and can include:
- determining the minimum detection threshold of a stimulus;
- assessing the discrimination ability between stimuli;
- creating scales to relate physical and perceived intensity;
- studying how the timing of stimuli affect perception; and
- studying how the spatial arrangement of stimuli is perceived.
For example, (Shoenberger and Harris 1971) suggest that changing the physical strength of a stimuli generating whole-body vibrations generates exponential changes in the subjectively perceived intensity. (Quick, Bontula, and Fitter 2022) showed that people tend to be more sensitive to vibrations on the wrists rather than the elbows, knees, or ankles and that we sense 55 Hz vibrations on the wrists at significantly lower intensity than 250 Hz vibrations.
Interesting findings also emerged by combining psychophysics and phenomenology. For example, it seems that top experiences, both good and bad, often have strong tactile components (Gómez-Emilsson 2019). In relation to this, Gómez-Emilsson and Percy (Gómez-Emilsson and Percy 2023) presented the heavy-tailed valence hypothesis (HTV): the idea that measuring valence and arousal generates scales that span at least two orders of magnitude. Thus very positive and negative bodily sensations may be orders of magnitude more so than mild ones.
Psychophysics closely relates to haptics, the engineering of touch sensations in computer applications. The design of haptic interfaces often involves considerations of
- positional information about the location of limbs in space;
- tactile feedback as static pressure or dynamic changes in pressure, texture and vibrations felt by the skin; and
- kinesthetic feedback as force and rotation exerted by or against the user.
Given its practical applications, it is important to investigate the quality of experiences that haptic engineering produces. For example, in 2021 QRI researchers explored the phenomenology of haptic stimulations looking for healing patterns to employ in psychedelic therapy (McGowan et al. 2022). Using a Subpac, a device designed to deliver sound in the form of physical vibrations, they examined different sound patterns and found that the majority of them did not feel good and that the further from simple patterns, the less pleasant the vibrations. They also found that simple nature sounds from vibroacoustic therapy produced the most pleasant sensations.
Finally, tactile illusions, by describing errors in tactile perceptions, can indirectly indicate what may be important mechanisms behind our sense of touch. (Hayward 2008) compiled a taxonomy of tactile illusions that includes:
- perceiving an incorrect number of objects;
- mislocalization of stimulation on the skin;
- misjudging the distance between objects in contact with the skin;
- misjudging the weight of objects;
- misjudging the number of separate stimuli;
- misjudging the orientation of a stimulus;
- change numbness, which works similarly to change blindness and dumbness;
- confusing the temporal ordering of tactile sensations;
- distal attribution of external space beyond the limits of our sensory organs; and
- motion after-effects.
In his video on why DMT feels so real, Andrés Gómez-Emilsson discussed how tactile illusions are among the most misleading sensory illusions. This may be because tactile sensations feel very embedded and familiar to our inner experience. We generally have a tendency to rely and trust them more given how close they feel to our being as opposed to auditory and visual stimuli which are somewhat associated with the external environment. DMT feels so real partly because it messes with tactile phenomenology in a way that is consistent with interacting with real objects, which is fairly unique to the drug. Another aspect that makes DMT tactile illusions credible is that of cross-modal coherence. DMT tends to bring together visual, tactile and auditory components as if they are all pointing to something that is really happening externally, which highlights how cross-modal coherence enhances our sense of reality.
Summarizing, in examining the sense of touch from various perspectives, several key and recurring elements emerge, including:
- modality
- valence
- intensity
- complexity
- cross-channel and cross-frequency attributes
- spatial and temporal attributes
- realism
- meaning
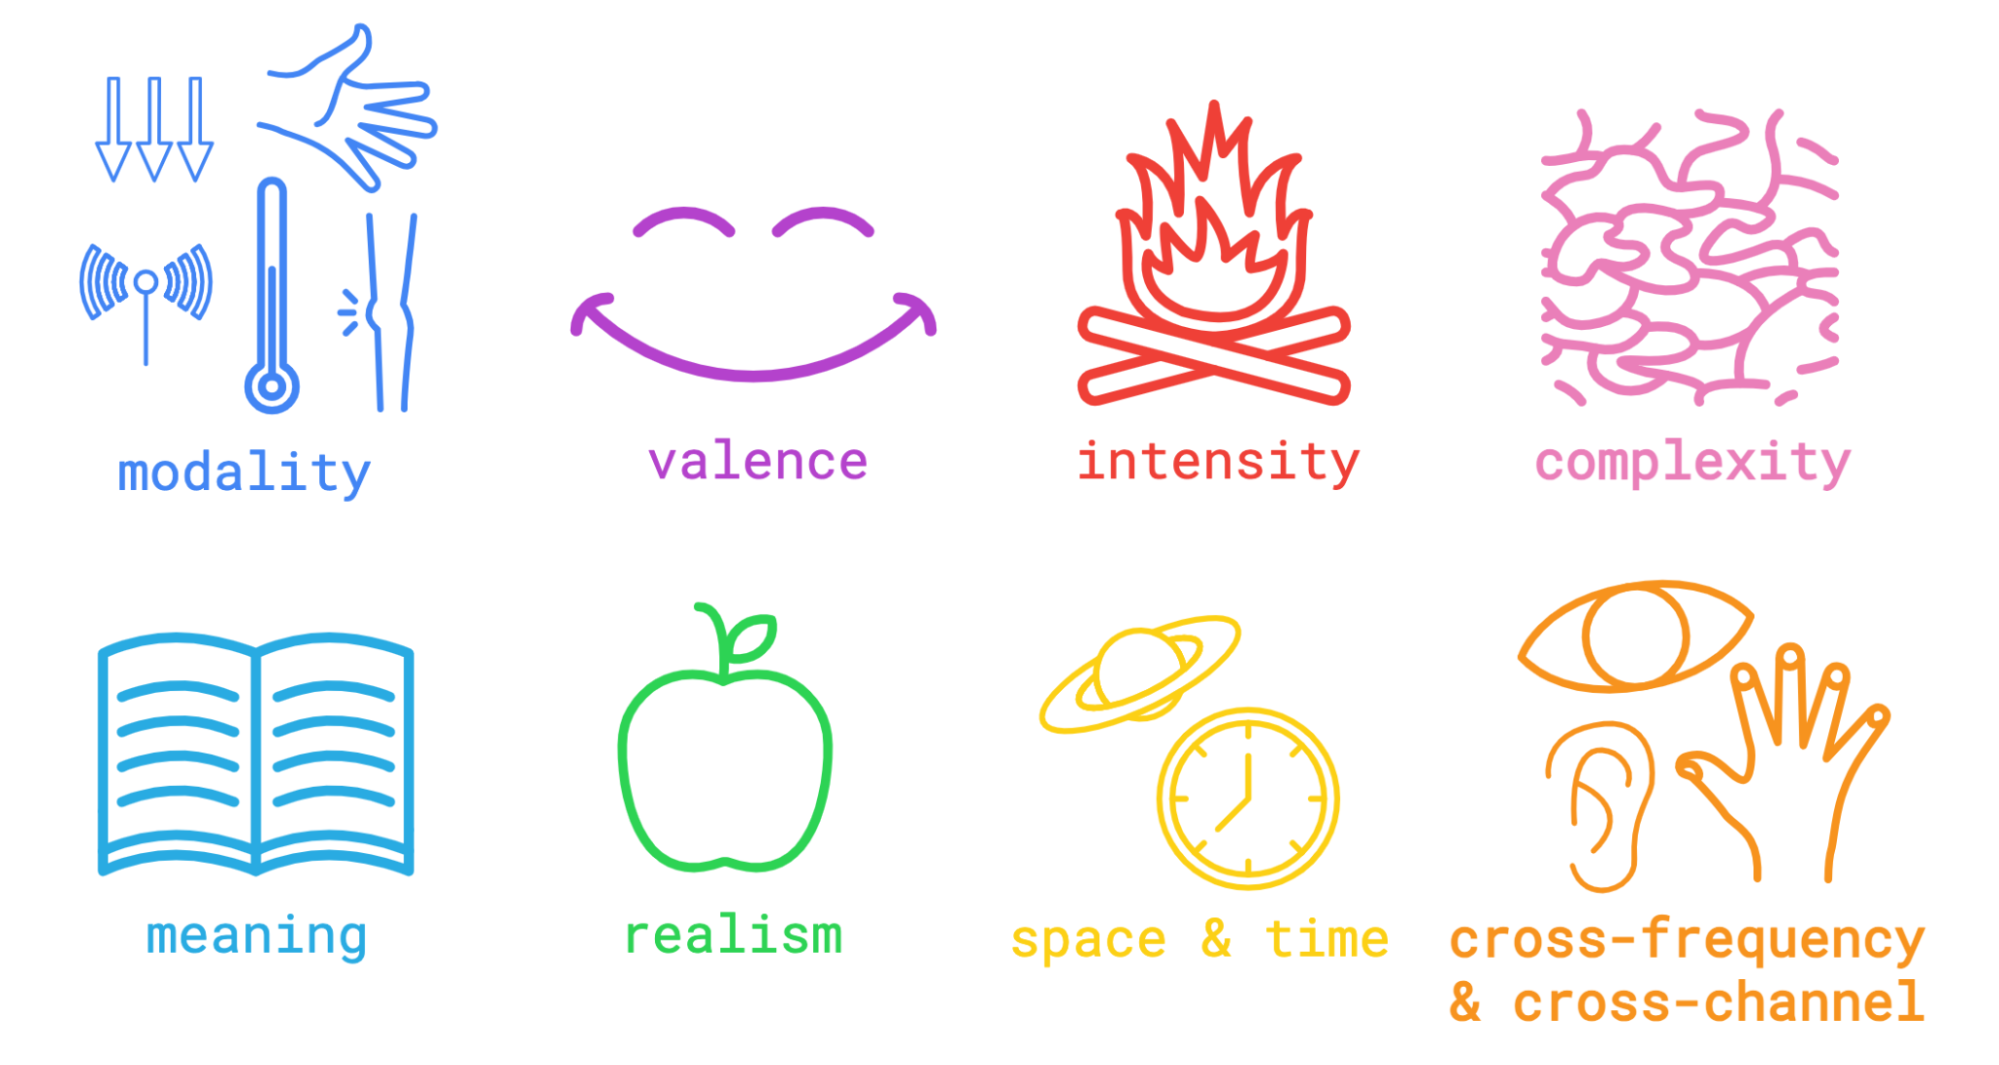
Touch modality refers to the physiological observations that tactile sensations include a variety of stimuli such as pressure, vibration, temperature, pain, position and movement. In psychophysics and haptics engineering, stimuli inducing different tactile modalities are generated using different physical sources like weights, motors, gyroscopes, etc. Thus, different touch modalities might be representable using different mathematical models that mirror the functioning of each modality.
Valence, intensity and complexity of tactile sensations are core aspects of how we subjectively perceive them, respectively referring to how pleasant, stimulating and diverse a sensation is. Historically, valence has been considered a purely subjective metric while intensity and complexity have been mapped to physical aspects of the stimuli. When building mathematical models that describe tactile sensations, valence, intensity and complexity usually correspond to specific parameters of such models. In our study, we focused on these three dimensions as they are both informative about subjective experience and relatively easy to report.
Cross-frequency and cross-channel attributes of tactile sensations describe how tactile stimuli change as a result of interaction between different frequencies and sensory channels. For example, when two sensations synchronize, it often produces a pleasant effect. Phenomenological reports often consider the relationship between sensory inputs as an important source of experiential character. Similarly, many tactile illusions originate from cross-channel interactions, such as misjudging the weight of an object from its visual size.
Spatial and temporal attributes are intrinsic and embedded in most experiences that we have. Experiences that exhibit spatial and temporal attributes that closely relate to external physical stimuli are deemed more realistic. Spatial and temporal attributes are essential aspects of dynamic systems that can be used to model sensations mathematically.
Finally, the meaning of a sensation holds the semantic significance that we associate with it. It is a multifaceted and inter-subjective attribute that stems from the convergence and juxtaposition of sensory fields with cognitive mappings. It is complex to model, unless reduced to simplistic categories.
The State-Space of Visualizing Tactile Sensations
Art, Synesthesia, Crowdsourced Maps
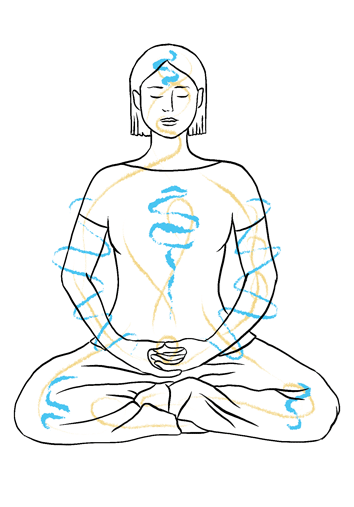
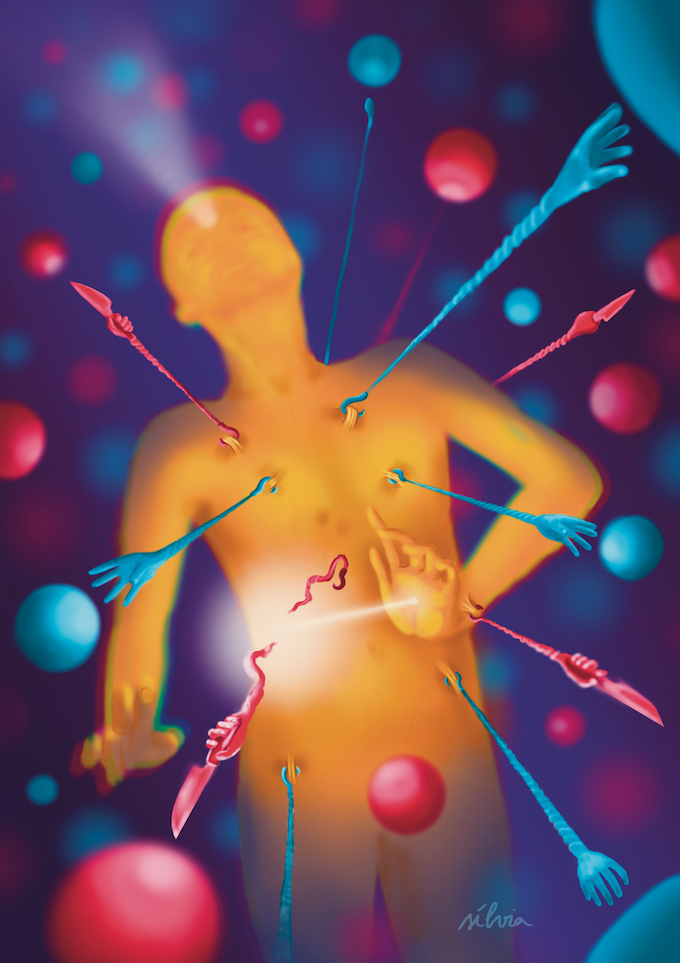
Differently from taxonomies, artists have been trying to describe bodily sensations by portraying them visually. A recent example that advocates for a specific yet subtle approach is the work of Sílvia Bastos, in which she depicts beautiful visualizations of bliss states and internal moves.
Some people also reported accounts of tactile-visual synesthesia, perceiving color and shape in response to tactile stimuli.

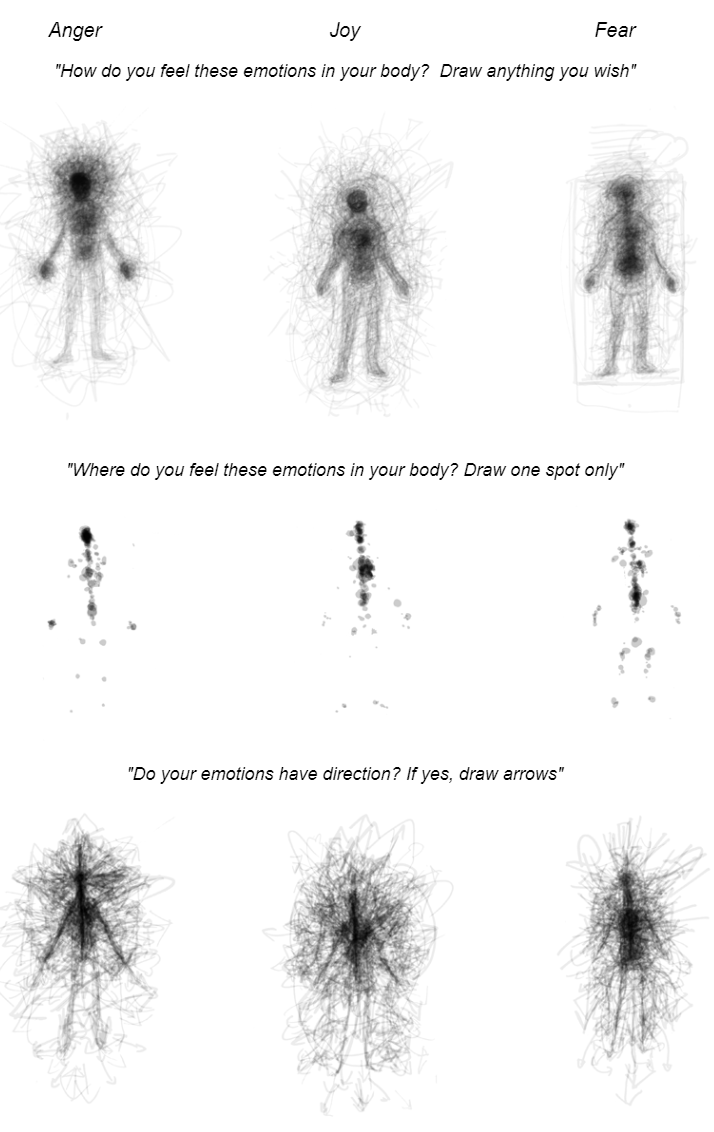
Orlagh O’Brien (O’Brien 2006) conducted a fascinating research project called EmotionallyVague where she combined visual responses of where and how people (n=250) feel anger, joy, fear, sadness and love. The aggregate visuals show evidence of clear patterns behind the emotions we feel in our body but also a lot of individual variation.
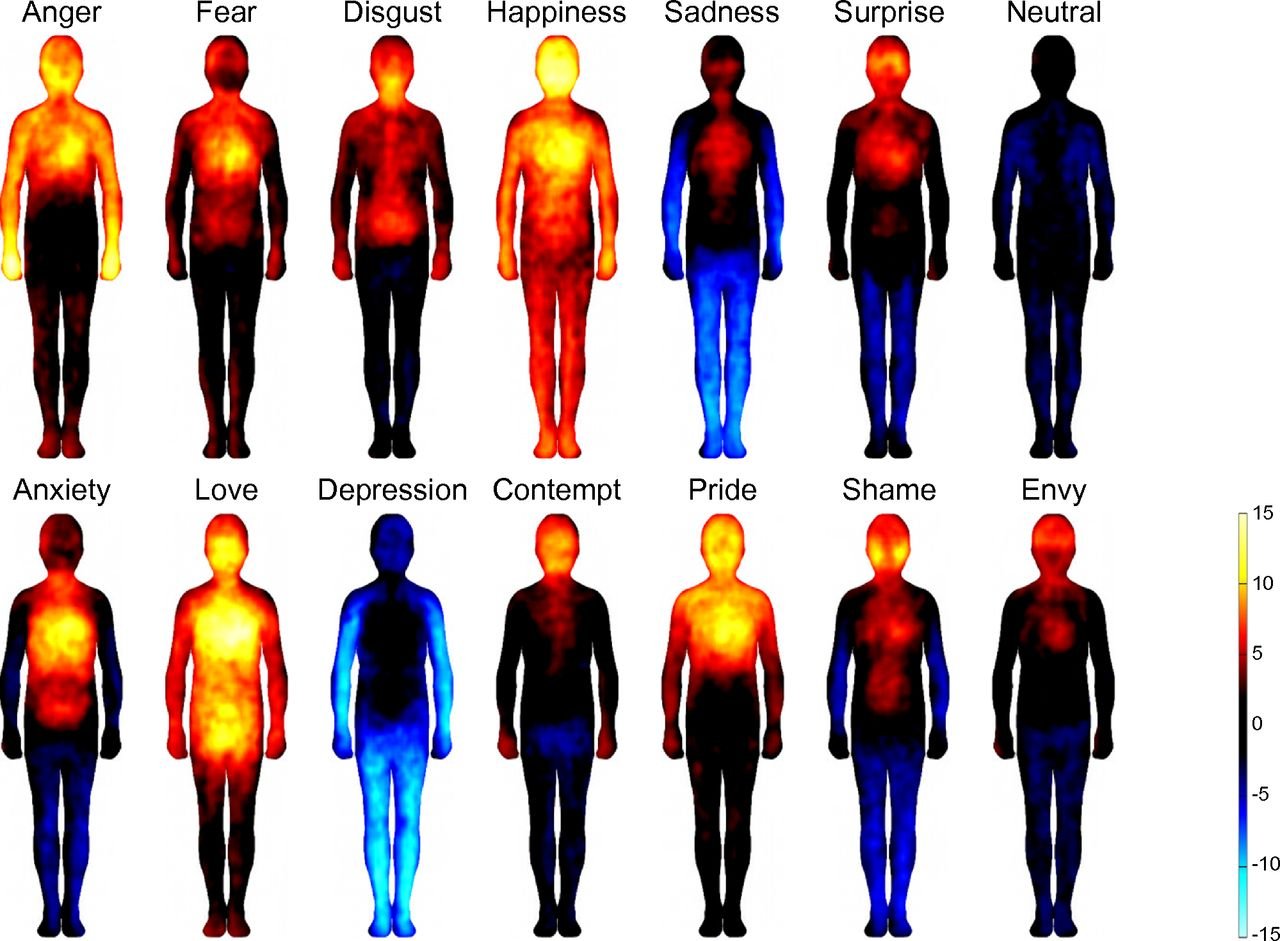
Another attempt at localizing emotions in the body leveraged topographical self-reports (n=701) to generate bodily sensation maps (Nummenmaa et al. 2014). This work showed clear patterns that could also result from nervous waves of activation or inhibition.
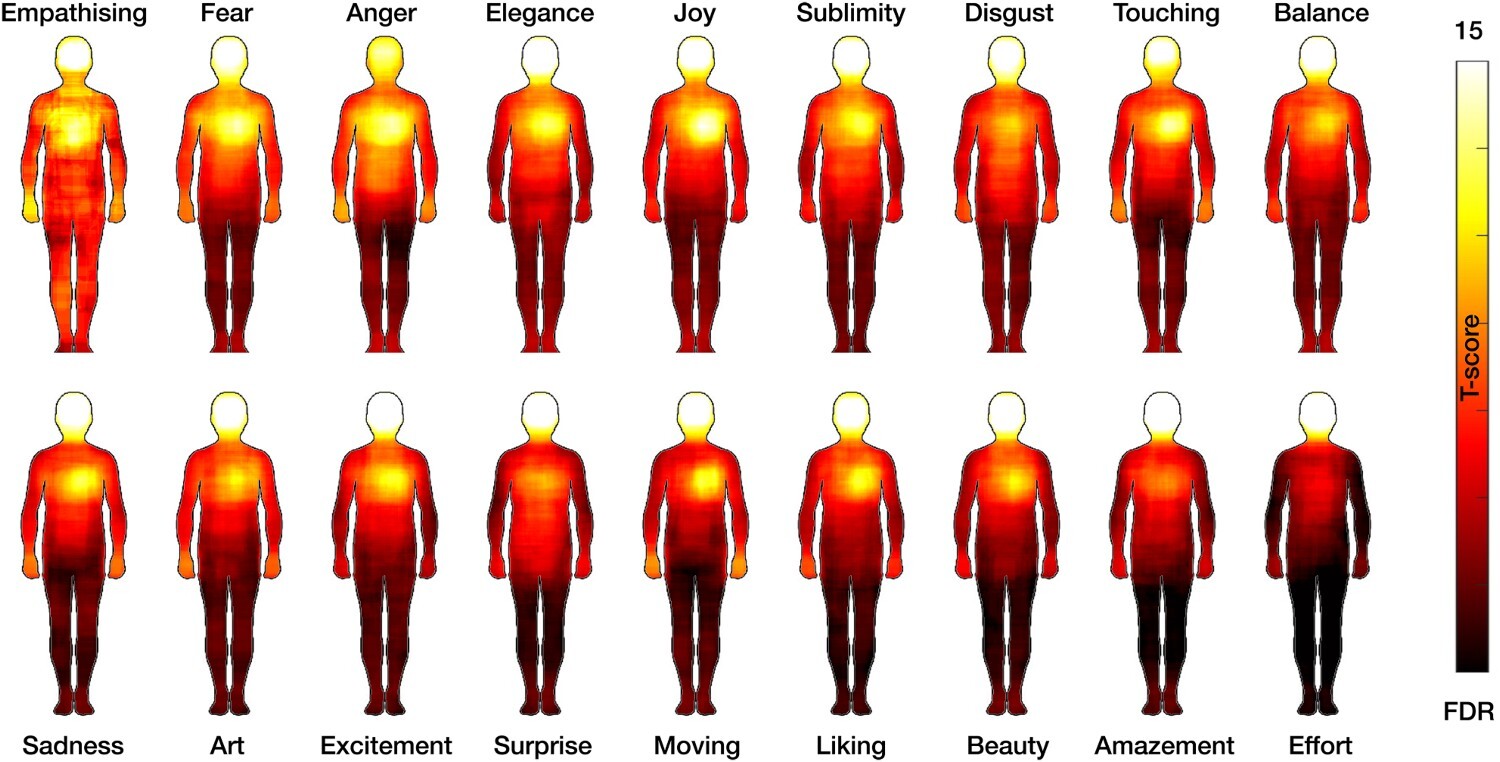
Building upon bodily sensation mapping, (Nummenmaa and Hari 2023) tried to quantify bodily fingerprints of emotions evoked by visual art (n=615). Using scale ratings, they investigated the relationship between visual art stimuli and 18 dimensions of subjective experience, including artistic impressions, basic and non-basic emotions, empathetic responses and effort. They found that most dimensions evoked chest sensations, while sensations in the upper limbs were most common for empathizing, fear and anger. Amazement and effort seemed to not result in significantly embodied feelings.
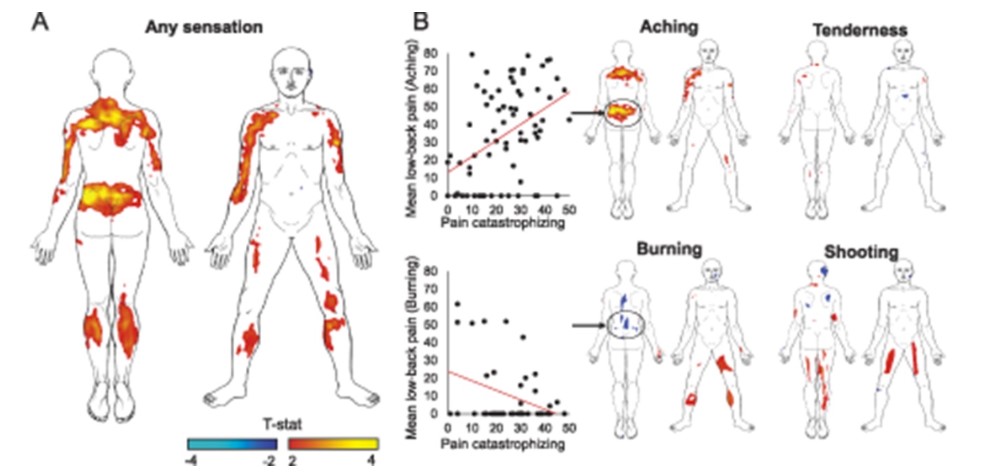
Overall, digital sensation mapping apps are maturing for a variety of uses, especially medical. For example, (Ellingsen et al. 2021) collected pain drawings from a pain sensation mapping app on a touch-screen tablet to investigate the relationship between pain catastrophizing, sensations in different body locations and modulation of different brain networks.
Our Attempts At Visualizing Sensations
Our initial attempts at visualizing tactile sensations mixed artistic and mathematical approaches. We used shaders to freely depict some sensations we experienced. After creating nine such images, we submitted them to a small sample of people (n=11) for evaluation. We decided to focus on the valence, intensity and complexity the visualization evoked as these dimensions are both easy to report and informative about the experience of the respondents. We also asked participants what bodily sensation each visualization reminded them of.
Survey participants evaluated the tactile visualizations in terms of valence, intensity and complexity using a 10-point Likert scale. On average, the sensations were mildly unpleasant (mean valence 4.0) and intense (mean arousal 6.3) with complexity ratings concentrated around the center (mean complexity 5.0). The image with greatest consensus reported a minimum standard deviation of 1.6 in intensity while the most ambiguous image reported a maximum standard deviation of 3.2 in complexity.
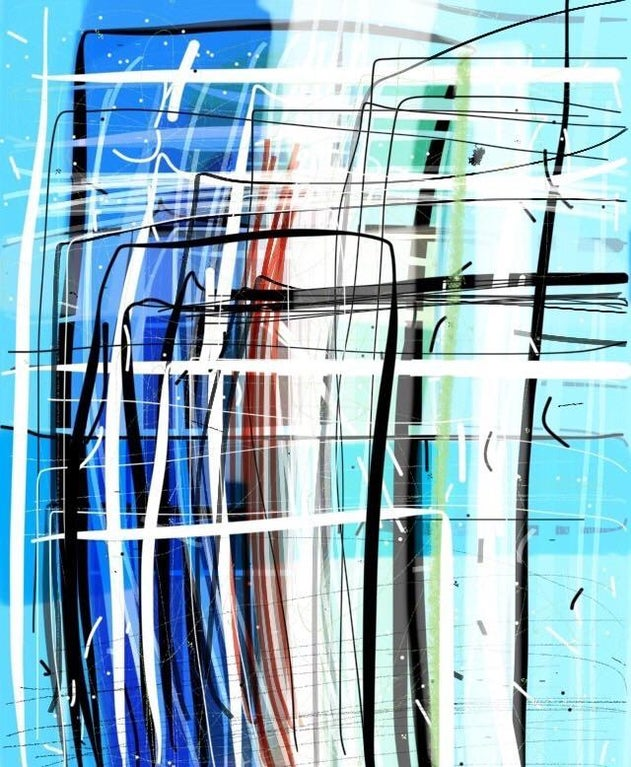
The most unpleasant visualization (2.1 valence) was described as body heat, inflammation, dehydration, itching, dizziness, feeling sick and worms walking on the body:
The most pleasant visualization (6.8 valence) was described as deep bodily relaxation such as when falling asleep, daydreaming in bed, receiving a full body massage or entering and lying down in water:
The most intense visualization (8.0 intensity) aimed to represent a strong headache caused by eye strain, using an exponential function and random jitter (see the shader code for details). Participants described it as suffering from head buzz or tingling but also as an orgasm or erection:

The most complex (6.0 complexity) aimed to represent a growing hip pain whilst sitting cross-legged, modeled as vibrational membrane modes of different intensity (for details see the shader code plus this introduction to vibrational modeshapes). Participants described it as numbness or movement in one leg but also tiredness and relaxation after effort.
Finally, the least intense and complex visualization (4.9 intensity and 3.9 complexity) aimed to depict tingling sensations experienced after Wim Hof breathwork, modeled as a R2 bell-functions of a sine wave (for details see the shader code). Participants described it as a breeze, heart beating during exercise, sweating, showering or feeling itch and prick.
Overall, our first attempts at creating tactile visualization appeared to evoke consistent and interpretable feelings. The image ratings reported standard deviations of around 23% variability (2.3 standard deviations on average on a 10-points Likert-scale). On average approximately a fourth of participants described feelings that related to what the creator intended to depict.
Theories of Perception and Valence
Symmetry Theory of Valence
A theory that informs much of the way we think about tactile visualizations at QRI is the Symmetry Theory of Valence (STV) originally introduced by Mike Johnson in Principia Qualia (2016), then expanded in connection to dissonance, consonance and noise by Andrés Gómez-Emilsson (Gómez-Emilsson 2017) who later developed its interpretation across a wide range of experiential domains (Gómez-Emilsson 2020a). STV says that
- we can map an experience to a mathematical object whose feature exhibit the same properties as the facets of the experience (i.e. qualia formalism);
- more symmetry in this mathematical object corresponds to more pleasure in our experience.
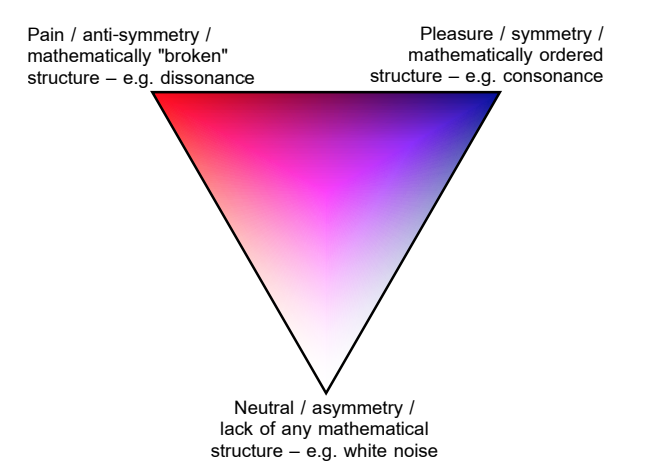
In STV, the connection between symmetry and valence is a core concept that informs many related predictions. Among those relevant for our work, first is the idea that there is a relationship between information content and the range of possible valence. More specifically, highly complex information (e.g. pure noise) drowns out any possible pleasure, while very symmetric states with information content approaching zero are blissful. States in between these two extremes, exhibit the widest range of possible valence.
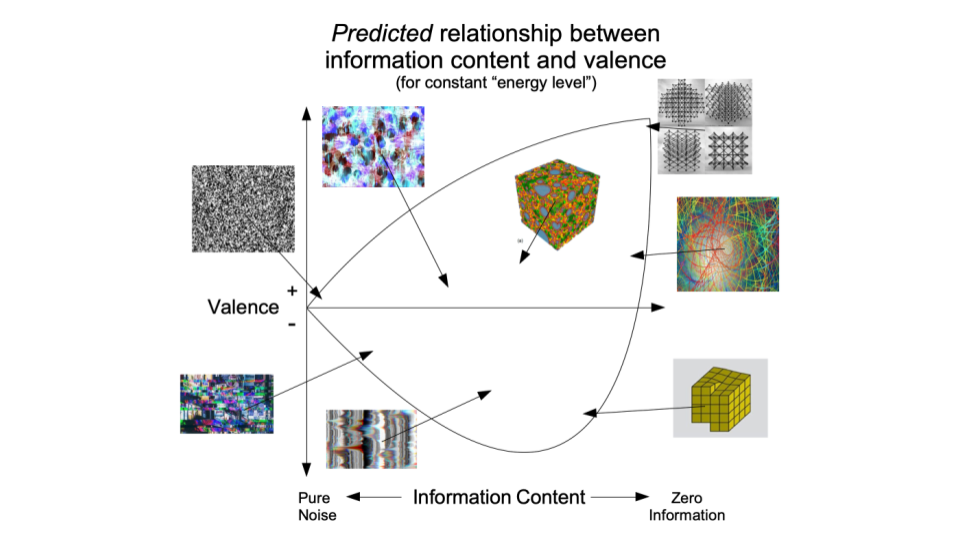
Note that STV also predicts that the most unpleasant experiences are also relatively simple; they contain clear but incompatible symmetries at the same time.
Biorhythm coherence
Another relevant theoretical prediction from STV is that during a pleasant experience, symmetry should manifest across many dimensions of experience such as patterns of the sensory stimuli, physiological biorhythms, and the phenomenology of the experience.
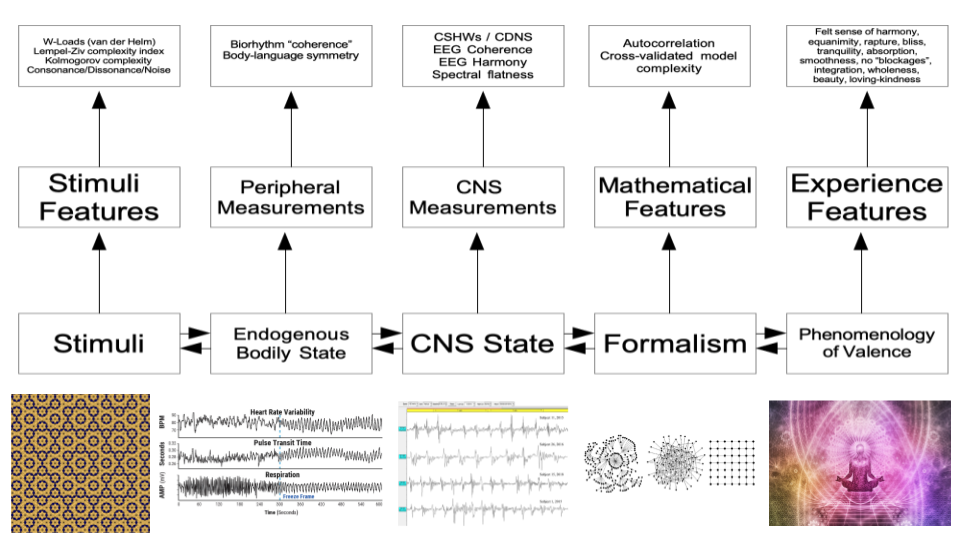
The relationship between biorhythm coherence, pleasure and well-being that STV predicts is confirmed by empirical evidence. Heart-rate variability seems to have a significant association with stress and health (Thayer et al. 2012). Similarly, breathing at resonance frequencies is associated with varied mental health benefits such as positive mood (Steffen et al. 2017). On the contrary, irregular heartbeat is linked with anxiety, depression, anger (Buckley and Shivkumar 2016) and post-traumatic stress disorder (Shah et al. 2013). Also, acute emotions can cause disturbances of cardiac rhythm (Ziegelstein 2007).
Other pleasant bodily experiences that involve symmetry are orgasm and flow. Orgasm entrains the motor system to neuronal oscillations synchronizing feedback across multiple functional networks (Safron 2016). Flow is often measured through the degree of coherence between oscillations of neurons, muscle activity and long-range synchrony between cortical regions (Cheron 2016).
In his overview of STV, (Gómez-Emilsson 2020a) gives a clear example of how STV interprets tactile experiences, comparing massage and bodily pain:
“Massage is kind of this very, very pleasant, harmonious, tactile pattern throughout your body that gives you these very nice waves of pleasure, as opposed to bodily pain. Bodily pain, if you introspect on it, it’s almost kind of like there’s like pinch points and discontinuities and fragmentations and deformations in your sense of self and the continuity of your skin or your felt sense of your inner organs. Basically, I would make the claim that bodily pain always manifests in one way or another as a kind of symmetry breaking operation.”
Auditory Consonance and Wave Symmetry
Regarding auditory stimuli, one may argue that Western Music implicitly discovered STV a long time ago. (Helmholtz 1875) defined the concept of musical dissonance by pointing out that playing two notes that are one semitone apart feels unpleasant because they are within a critical window in which they generate beat patterns: asymmetries in the overall waveform.
(Plomp and Levelt 1965) found that when people rated pairs of sinusoidal sound waves, they were most harmonious at the same pitch and less so as the pitches diverged, reaching a low point before increasing in harmony again. They defined this pattern as tonal dissonance.
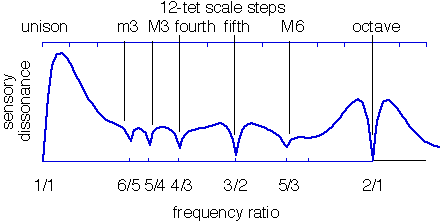
Do tonal dissonance curves translate to the tactile domain? We speculate that two interacting vibratory tactile sensations result in a pleasant sensation when they have the same frequency (i.e. unison 1/1), in an unpleasant sensation as their frequencies start to differ and progressively less unpleasant as their difference grows. Furthermore, people may experience peaks in valence nearing symmetrical frequency ratios between two vibratory stimuli (e.g octave 2/1, fifth 3/2, fourth 4/3, etc.)
Another important concept we borrowed from sound modeling is the envelope property of a wave: attack, decay, sustain and release (ADSR). ADSR predicts the valence and arousal of tactile vibrations by postulating that slowly and gently rising envelopes are more pleasant than sharply and quickly growing ones.
Similar to how in music we have major and minor keys, (Johnson 2018) speculates that the brain modulates valence in a predictable way using what he calls affective key signatures: combinations of periodic neuroacoustic frequencies used by the brain to self-organize that may give rise to our phenomenological dynamics. Furthermore, as Andrés suggests in his essay on Nonlinear Wave Computing: Vibes, Gestalts, and Realms (Gómez-Emilsson 2022), if the brain functions as a non-optical computer then vibes (i.e nonlinear nervous waves interacting with linear nervous waves in a stable way) may inherit their pleasantness from the wave symmetry and the ADSR envelope. QRI’s Tracer Tool seems to bear this general pattern in the visual domain (Gómez-Emilsson 2020b) while direct Subpac exploratory work seems to exhibit related patterns in the tactile domain (McGowan et al. 2022).
Our Experiments
Informed by taxonomies, theories and exploratory work, we ventured in investigating whether people consistently judge the qualia of visualized body sensation and what patterns could we find in them. We decided to test some predictions from STV and tonal consonance. The intention behind our experiments was to get a first indication of the effects at play when generating and embodying tactile visualization. We did not intend to conclusively prove any specific effects. As such, our experiments should be seen in the light of suggesting likely effects. Proving specific effects would require more careful experimental design, including aspects such as pre-registration and precise control of variables.
The technical details about all our experiments can be found in this public GitHub repository: https://github.com/ricvolpe/qri-tactile-viz-research. It includes both the data we have collected for our experiments as well as the code of our analysis. We welcome researchers to both extend or replicate our work.
Parametric Sine Waves
First, we ran two experiments displaying sinusoidal waves, parametrized in different ways. We asked survey respondents to try to embody the visualized sensations and rate how pleasant, intense, stimulating and complex they felt when doing so. We used two different stimuli. One stimuli displayed fast low-amplitude waves over a full body silhouette:
The second stimuli showed a silhouette of the upper half of the body with slow high-amplitude waves forming whole thorax blobs, that could be more easily embodied by associating them to breathing movements:
Experiments using these two stimuli showed indications that higher frequencies lead to more intense, more complex and less pleasant bodily sensations. This seems true for both temporal and spatial frequencies, although the effect is more pronounced for temporal variations. This result suggests a relationship where arousal and complexity are inversely correlated with valence, consistent with the relationship between information content and valence suggested by STV.
Furthermore, we observed that pairs of waves with identical waveforms that vibrate in unison tend to be less intense, less complex and more pleasant than pairs of waves with differing waveforms. However, we were not able to fully replicate the tonal dissonance curves where dissonance regularly dips at simple frequency ratios (i.e. the octave at 2/1, the fifth at 3/2, the fourth at 4/3, etc.). The empirical curves from our experiments partly resembled the tonal dissonance curves but also displayed a lot more noise. Sources of noise may include individual variability and factors such as the order of the stimuli sequence or unintended asymmetries generated by the combination of parameters.
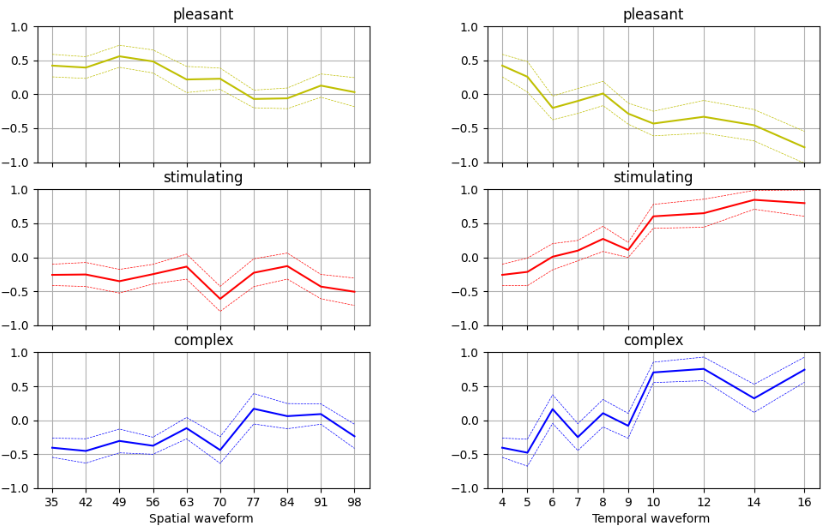
Below we show all the tactile dissonance curves from our first two experiments showing valence (how pleasant), arousal (how stimulating) and complexity (how complex) rating for different waves-based tactile visualizations.
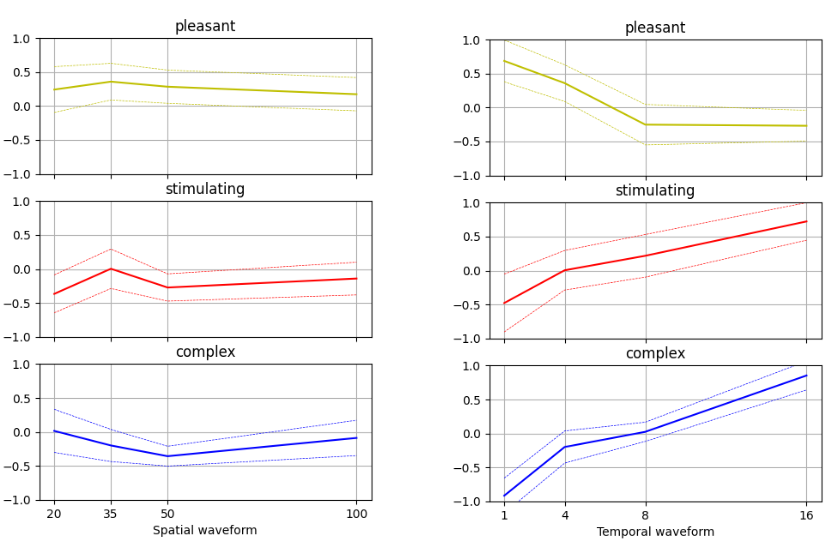
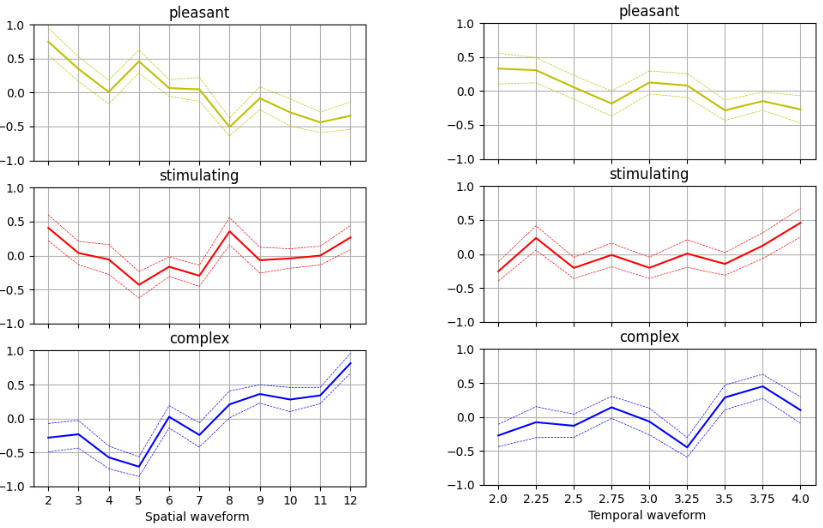
As an example, let’s look in detail at the temporal tactile dissonance valence curve for stimuli 2 (bottom right chart, top yellow curve). It shows valence ratings for pairs of superimposed waves where one wave had a temporal waveform of 2 Hz and a spatial waveform of 1 vertical band and the second wave had the same spatial waveform but varying temporal waveform as displayed on the x-axis. From the curve we can see
- an overall effect of higher temporal frequencies producing lower valence; and
- peaks and dips in valence at different superimposition ratios that seem to follow the patterns of tonal dissonance but with more noise. For instance, in this example we see a minor dip in valence at the octave (4Hz, 2/1) which contradicts the prediction of tonal dissonance but may also be due to effect (a) and variability in the data. However, we can see a corresponding dip in complexity (blue curve below) at the same data point.
To see these effects firsthand, this YouTube playlist plays the stimuli rated in this curve in order (note: if the playlist order has mistakenly changed, make sure to watch the videos in alphabetical order). At a quicker glance, below are the first and last stimuli of the curve
In our first experiment with single sinusoidal waves (top right chart) we can see that higher temporal frequencies led to higher arousal and lower valence. Thus, effect (a) happens irrespective of the superimposition of the two waves and makes it challenging, when combining pairs of superimposed waves, to isolate the valence effect of the superimposition asymmetry (effect b) from the baseline effect (a) of the increasing frequency. Follow-up work will use a cross-validated fixed-effects regression model to separate effects (a) from (b) and pin-point more precisely the effect of dissonant superimpositions on valence.
Frequency, symmetry, and emotions
In his overview of STV Andrés (Gómez-Emilsson 2020a) starts by describing how valence and arousal roughly account for 60% of the variance of emotional content. Further, he describes how combination of variance in valence and arousal gives rise to certain emotions. More specifically, high arousal and high valence produce excitement, high valence and low arousal give rise to serenity, low valence and low arousal lead to feelings of depression and high arousal and low valence are anxiety producing.
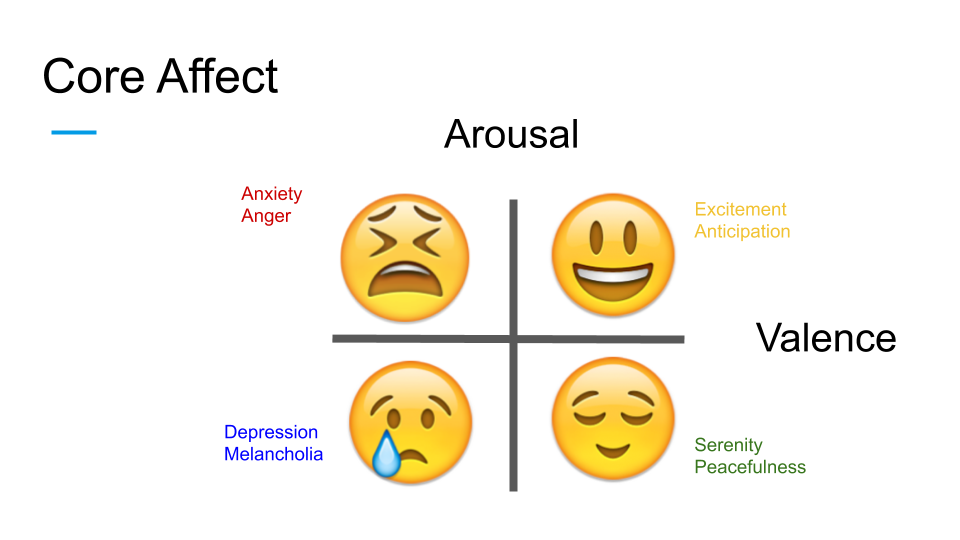
With this 2x2 relationship in mind, we adopted the further assumption that arousal relates to the frequency of a tactile vibration while valence relates to the consonance and dissonance and the envelope features of the vibratory stimuli. Following these ideas, we created four different stimuli, as combinations of low-high frequency and low-high symmetry of sinusoidal waves over a body silhouette aiming to depict excitement, anxiety, serenity and depression.
We showed the four stimuli to 50 survey participants, invited them to try to embody them and asked them whether the visualization was easy to embody, pleasant, stimulating and which emotion best described how their body felt, out of the four options emotions we tried depicting. The results yielded the following confusion matrix:
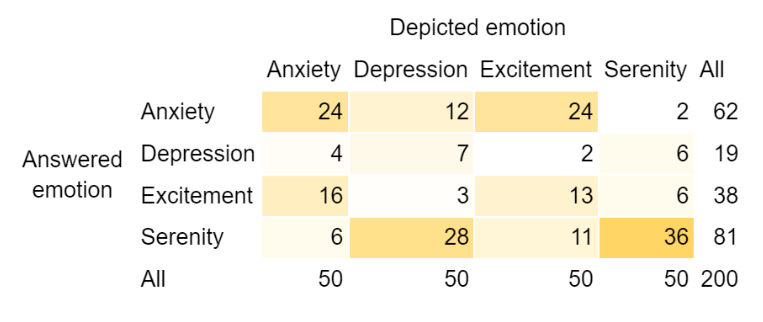
From the confusion matrix we can see that
- serenity and anxiety were selected more frequently than they were depicted by us (see marginal column, last); and
- what we depicted as depression was often confused as serenity (second column) while what we depicted as excitement was often confused as anxiety (third column).
This shows the same finding that people tend to strongly associate low-frequency waves with pleasant emotions and high frequency waves with unpleasant emotions. Overall it seems that for visualized tactile sensations the effect of frequency on valence seems to often overshadow the effect of symmetry on valence.
We also looked at aggregate ratings statistics for both the emotions we depicted and answered by participants. While our depiction of depression was the hardest sensation to embody, this was true also when participants themselves felt depressing feelings.
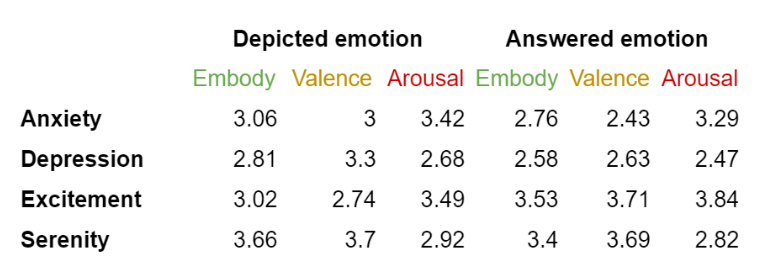
Emotions felt by participants reported scores that are consistent with the valence-arousal 2x2 framework. On the contrary, when grouping responses by the emotions we depicted we can see deviations from the 2x2 relationship. The arousal scores, linked to the frequencies used in the visualizations, map closely to the arousal scores of the felt emotions. However, the valence scores do not, since excitement was often confused as anxiety and depression as serenity.
Furthermore, in the data we found a high empirical correlation between ease of embodiment and valence (r = 0.53, n = 200, p-value < 0.0001) indicating that another factor that may influence the pleasantness of the experience besides frequency and symmetry is how easy it is for that person to embody the depicted emotion.
Looking Ahead
QRI is pursuing a beautiful mission that includes
- developing a precise math of subjective experience;
- understanding the nature of happiness and suffering;
- mapping out the space of possible states of consciousness and
- building technologies to improve the lives of sentient beings.
Visualizing valence is an endeavor at the forefront of QRI’s priorities as it holds the potential of simultaneously bringing progress in many if not all of these directions. Systematically visualizing tactile sensations allows us to empirically test mathematical models of subjective touch while learning about what generates pain and pleasure somatically. A dynamic generative tool that can depict different tactile feelings can advance our mapping of the state space of touch but also allow people to better communicate and manage their pain. As such, during the next few years, developing a tool to parametrically visualize valence is likely going to be one of QRI’s top priorities.
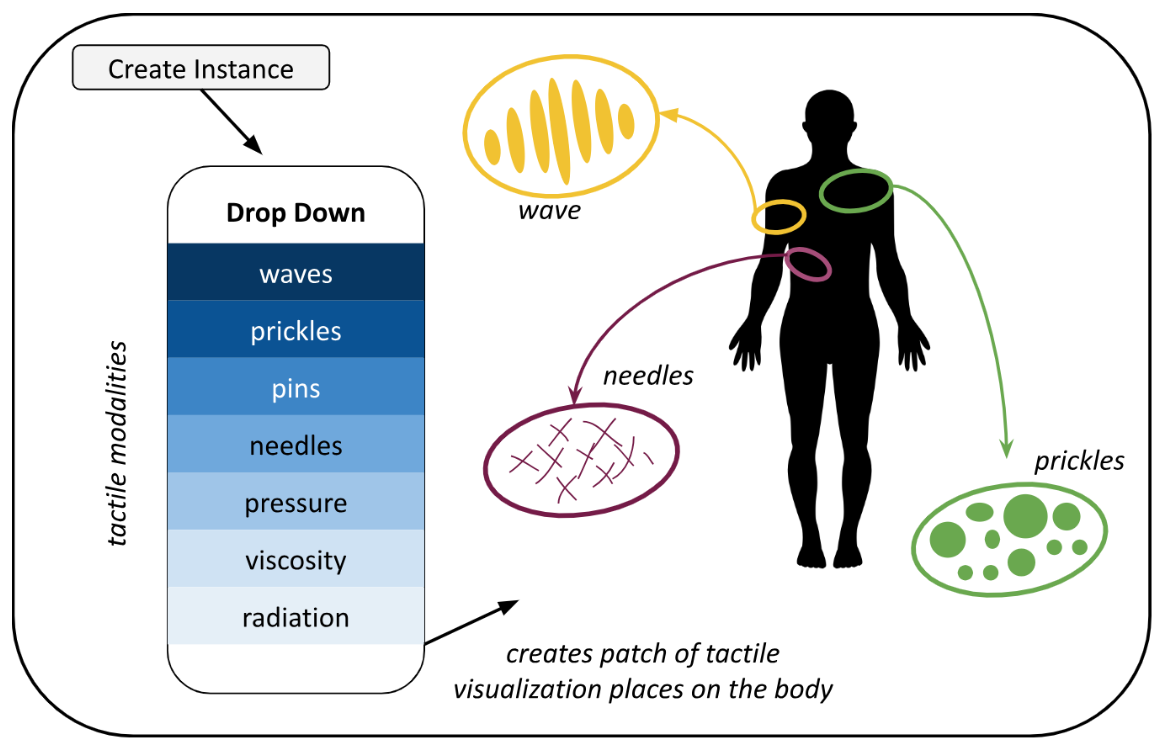
At a high-level the ambition is to empower users to be able to produce new tactile visualizations from a drop-down menu that displays tactile modalities, such as waves, pins, needles and prickles. Each modality will have its specific features, in addition to a shared set of parameters about spatial distribution. For example, the waves category may include features like location of center, height and width of window, spatial frequency, temporal frequency, type of wave (e.g. sinusoidal, triangular, square, seesaw, etc), angle of movement and kernel for the window (i.e. how sharp/soft is the boundary of the window). Similarly, for pins we would have parameters for location, temporal and spatial frequency, and orientation. In addition, we also may want to be able to select the distribution for how the pins arise (e.g. uniform Poisson) and how they cease (e.g. exponential). For needles we would also have their average length. For prickles, which are sort of between pins and needles and are more like regions that go in and out, some parameters for their size would be useful. The philosophy behind the simplicity of the tool is to get a baseline for the bare-bones outline of tactile feelings. We might not need to go all the way to modeling nerve fibers if 70% of the variance between kinds of states is explained by rough features like frequency, location, and category.
Another exciting idea that we have is to combine a valence visualization tool with specific somatic meditations that can help people learn how to introspect, notice feelings and understand how to measure them. Imagine an introspective meditation aimed at blockages mapping by trying to project resonant waves or water going down the body and notice in which places the waves are not going through. Then, noting down these places on a body silhouette in the tool and adding important properties such as whether the blockages are active vs passive (i.e. whether we noticed them beforehand or only after we tried projecting a wave through the body part). Long-term this could lead to the development of a standard method for assessing the pre-post valence and effect on body blockages of techniques like Yoga or MDMA-assisted loving kindness meditation. Using this structuralist perspective to show the causal effect of blockages on valence could help explain whether somatic blockages are the factor that mediates valence in bodily practices, similarly to how mystical experiences mediates the therapeutic effect of psychedelics (Griffiths et al. 2008). Besides somatic blockages, one can think of other modalities of meditations that may introspect into body feelings such as thermal interoception to find inflammations or psychological spaces to identify how traumatic mental construct may map to bodily experience (e.g. high-school math trauma in the shoulders).
Some of these are only speculative ideas, but at QRI we are excited to explore this uncharted territory. If you are also excited about the space of visualizing valence and modeling bodily sensations and/or passionate about improving the lives of sentient beings, reach out and fill out our general application. We are looking for collaborators, especially if equipped with transdisciplinary skills across math, philosophy, phenomenology, psychology, physics and software development.
In the meantime, while we make progress on visualizing valence, we can already recommend some QRI meditations that involve playing around with bodily perception, feelings and valence:
- Varieties of Attention
- The Energy Parameter
- Textures of Valence - Consonance, Dissonance, and Noise
- Harmonic Meditation
- Co-Arising Expansion and Contraction
Acknowledgements
We want to thank Hunter Meyer for the continuous support and encouragement in the pursuit of this project and Scry Visuals for the help with understanding and getting started in working with shaders.
Tags
Ethics, Future, Drugs, Harmonic Society, Hedonic Tone, Psychedelics, Qualia, Valence, Wireheading